
The client report that defends your retainer
Clients don’t fire agencies over results — they fire them over unexplained results. The report structure, cadence, and metrics that make renewals boring
Clients rarely fire agencies over one bad month. They fire agencies over months they didn’t understand — reports full of impressions and acronyms, silence when numbers dipped, no visible connection between the invoice and the outcome. The client report is where your work becomes legible, and legible work gets renewed. Here’s the structure that survives, and how Chatfuel compresses its assembly from a day to minutes.

Cadence: weekly first, monthly forever
- New clients: weekly for the first 60–90 days. Trust hasn’t compounded yet, and early campaigns pivot fast; a weekly one-pager beats a monthly masterpiece delivered after doubt has set in.
- Established clients: monthly, with enough history to show trends instead of noise.
- Either way, the report is the agenda, not the deliverable. Send it before a live call and walk through it. A PDF into the void reads as an invoice justification; the same numbers on a call read as strategy.
The five-part structure
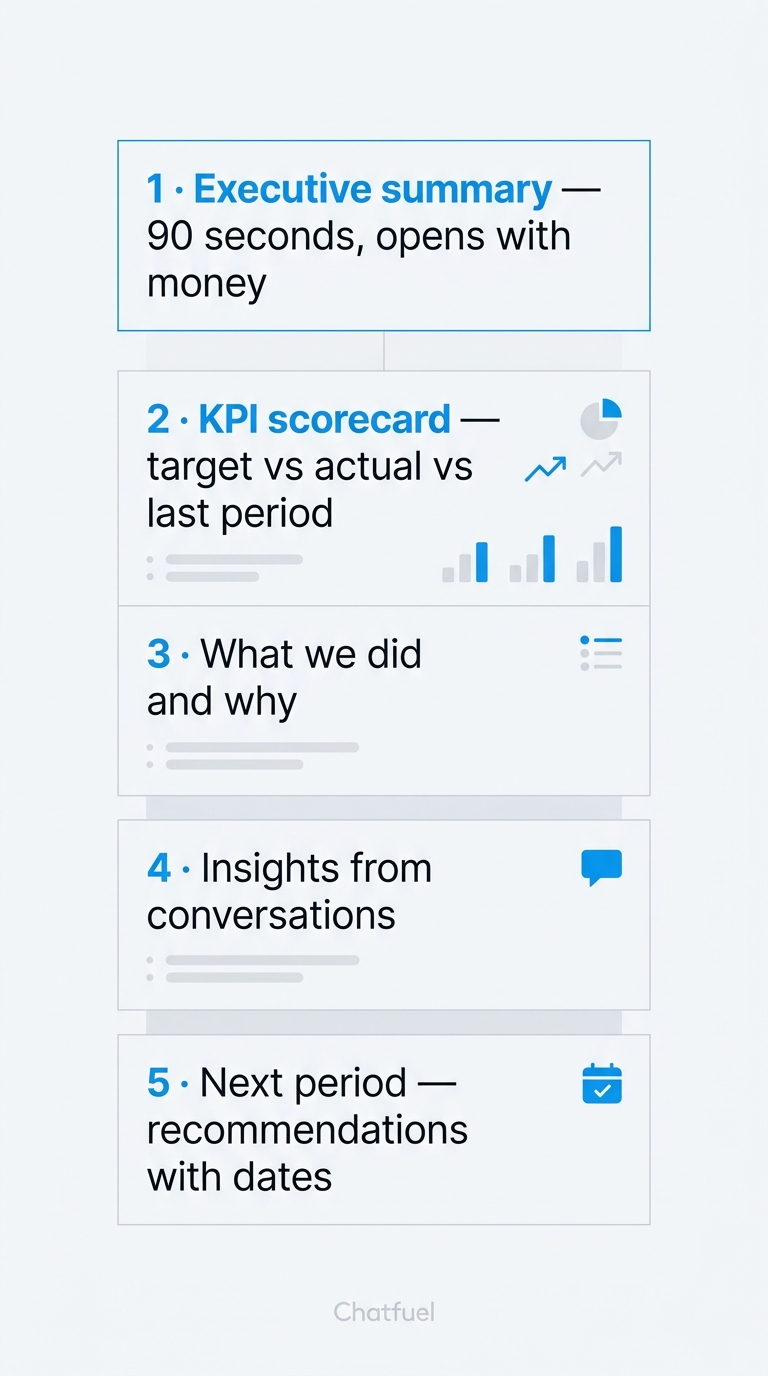
The format that survives contact with real clients, in reading order:
- Executive summary — readable in 90 seconds, opening with money: qualified leads, cost per qualified lead, sales, ROI. If the client reads nothing else, they’ve read the part that matters.
- Scorecard — the KPIs you committed to, target vs. actual vs. last period, one line each. This is where “how does this month compare to last?” earns its keep.
- What we did and why — the narrative: what was tested, what changed, what the data said. “CPQL on the offer-B ads ran 2.6× the sibling — killed them, moved budget, refreshed creatives against the price objection.” This paragraph is what the retainer buys; a dashboard can’t write it.
- Insights — the “why” behind the numbers, straight from conversation analytics: the objection that kills deals, the question forty leads asked, what won leads had in common.
- Next period — specific recommendations with dates. Ending with a plan converts the report from a grade into a roadmap — and quietly renews the retainer every month.
ROI is the headline, ROAS is the detail
Two numbers get conflated and shouldn’t be. ROAS — revenue over ad spend — is your channel-level tool, right for comparing campaigns. ROI counts all the money, your fee included — and that’s the number the person paying the invoice actually means when they ask “is this working?”. Lead with ROI to the decision-maker and keep ROAS in the breakdowns: an agency that volunteers “our fee is in this math” removes the objection before it’s raised.
Metrics clients pay for vs. vanity
The right column isn’t useless — it explains why the left column moved (“CTR fell 25%, creative fatigued, refreshed the batch — CPQL already recovering”). It just never leads. A report that opens with impressions tells the client you’re hiding something; a report that opens with cost per sale tells them you aren’t.
Compile it by asking
The classic cost of good reporting is assembly — a day per client of spreadsheet stitching, which is why most agencies ship worse reports than they’re capable of. With the Co-Worker as analyst, assembly collapses into a short interview per client company: “business report” for the funnel, conversions, and recommendations; “how does this month compare to last?” for the scorecard deltas; “why do deals fail” for the insights section; ad spend joins from Ads Manager for CPQL and cost per sale. Numbers in minutes — your time goes into the two sections clients actually renew for: the narrative and the plan.

Report the bad month before the client asks
The dip you flag first, with a diagnosis and a fix already moving, builds more trust than the good month ever did. The dip the client discovers on their own costs the account. Speed of explanation is a retention metric — treat it like one.
Where to next
The metric chain the whole report hangs on.
The interview that replaces report-assembly day.
The chart that settles “whose stage is leaking” with data.
One company per client — why reporting stays this clean at scale.